AMED is a broken down stock. The momentum surged yesterday for a clean breakout. Today morning it gapped up to the highest of day, then dropped hard. People will definitely take profit when stocks gapped up huge without any news driven. This kind of trades can be taken for a quick overnight profit.
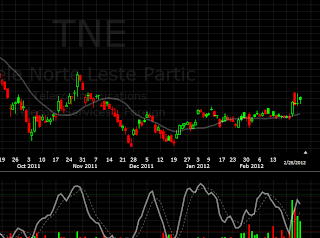
I had a similar trade for TNE on last Thursday. Last Friday TNE gapped up huge then faded. I did not take profit quickly early morning and ended up a losing trade.
Tuesday, February 28, 2012
Saturday, February 25, 2012
15m bounce setup looking for
This is one of the setups I noticed working from time to time. The ticker is CHRS from 02/22 to 02/23. It is a 15-minute bounce setup. The key is to look for the RSI divergence. The price is forming a double bottom or gradually flattened, but RSI is rising up but below 50 to form a divergence. The conservative entry is to enter next day early morning once the stock are showing sign of going up. Usually the upside momentum can only last for half an hour, then it may reverse hard. I think it is a good day trading method.
Another good example to show this is the AKAM in the past weeks. As it can be shown on chart, the setup is shown up on early day of 02/21, but the bounce is very weak. It gapped up then faded away to dive down. I think the intraday setup is not quite reliable. On end day of 02/23, the 15m bounce setup came once again. And this time it works. I guess it due to that AKAM touched the 20EMA on daily chart. Traders still weight a lot on the support on daily chart.
Another example in KBH
How to implement this in Telechart or TOS to find this kind of setups? In TOS, my implementation is as follows:
Lowest(rsiWilder(14), 52)<=20 and rsiwilder(14)<=50 and rsiWilder(14)>=40 and SimpleMovingAvg(close, 20) * SimpleMovingAvg(volume, 20) >= 250000
Some of these setups from the scan by Friday:
BRCM, VTR, TLAB, UN, EAT, CWH, ADTN
potential setup for next Tuesday or after (maybe):
MPC, ERF, CDE, WMS,
Monday, February 20, 2012
Trading the S&P 500 After An Overbought Period Ends – Using the Percentage of Stocks Trading Above Their 40DMAs by Dr. Duru
http://drduru.com/onetwentytwo/2012/02/19/trading-after-overbought-period-ends/
T2108, the percentage of stocks trading above their 40-day moving averages (DMAs).
Here are the fundamental conclusions I generated from analyzing the S&P 500′s behavior between overbought periods since 1986. For convenience, I will call this the “interim period.”
Extended rallies are typically characterized by a series of overbought periods.
There is no relationship between the duration of the overbought period and the maximum loss before the next overbought period. However, the largest losses have all occurred after overbought periods that lasted 20 days or less. After longer overbought periods, the maximum loss during the interim period has been 10%.
There is also little relationship between the length of the interim period and the maximum loss during that time. However, losses of 10% or greater have ALL occurred when the interim period lasted between 50 and 155 days.
After excluding interim periods that included oversold periods, there is a stronger relationship between the duration of the interim period and the maximum loss. The vast majority of interim periods have lasted less than 50 days.
Given these observations, traders should treat rules for trading between overbought periods as general guidelines. The risks are worth the rewards IF traders size positions modestly, prepare to make multiple trades, take at least some profits after moderate declines, AND stop out by the time T2108 has begun a new overbought period.
Specifically, traders should follow these guidelines:
Short early but in moderate size once an overbought period begins.
Never build a “full” trading position just in case the overbought period lasts longer than 20 days, and/or reduce the size of the bearish position after 20 days. Hedging against the bearish position counts as a reduction in risk.
Start taking profits no later than a decline of 5% or so on the S&P 500 during the interim period. Stop out by the time the next overbought period begins.
Sunday, February 19, 2012
一次读完30本经济学经典
Download link: http://fp.io/2d86cam5/
本书列举了30本历代经济学大师的传世巨著,这些经典之作,不仅在当时的社会背景下.为人们解决了一个个复杂多变的棘手的经济问题,推动了人类历史的进程,而且在21世纪的今天,我们仍能从这些大师身上学习到宝贵的经验与智惹,来解决当前所面临的各种问题。
编者用最简洁的语句,为你讲述伟大作品的精华。用最浅显的文字,连释大师们的深邃。用最好住的字句,传递原著中令人难解的理论。期望让读者在最短的时间内,了解每一位大师给予我们的忠告和教诲。
本书目录
第1部 《经济表》
第2部 《国富论》
第3部 《人口原理》
第4部 《政治经济学概论》
第5部 《政治经济学及赋税原理》
第6部 《政治经济学新原理》
第7部 《政治经济学的国民体系》
第8部 《政治经济学原理》
第9部 《资本论》
第10部 《政治经济学理论》
第11部 《国民经济学原理》
第12部 《纯粹政治经济学纲要》
第13部 《资本与利息》
第14部 《经济学原理》
第15部 《利息与价格》
第16部 《财富的分配》
第17部 《有闲阶级论》
第18部 《经济发展理论》
第19部 《福利经济学》
第20部 《不完全竞争经济学》
第21部 《就业、利息和货币通论》
第22部 《价值与资本》
第23部 《通往奴役之路》
第24部 《经济学》
第25部 《丰裕社会》
第26部 《经济成长的阶段》
第27部 《人力资本投资》
第28部 《资本主义与自由》
第29部 《经济学》
第30部 《经济学原理》
Monday, February 13, 2012
How to Look for and Trade Earnings-Related Breakouts from Chart Swing Trader
A great post about PEAD written by Chart Swing Trader.
http://www.chartswingtrader.com/2008/05/how-to-look-for-and-trade-earnings.html
Sunday, February 12, 2012
Essential Books for growth and momentum traders listed by Stockbee
Stockbee listed the following list of Essential Books for growth and momentum traders. I will post links to download these books later.
William O'neil
Read all editions of O'Neil book starting with First Edition
How to Make Money in Stocks: A Winning System in Good Times and Bad, Fourth Edition
The Successful Investor: What 80 Million People Need to Know to Invest Profitably and Avoid Big Losses
How to Make Money Selling Stocks Short (Wiley Trading)
24 Essential Lessons for Investment Success: Learn the Most Important Investment Techniques from the Founder of Investor's Business Daily
How To Make Money In Stocks: A Winning System in Good and Bad Times-
Jesse Livermore
Reminiscences of a Stock Operator (Wiley Investment Classics)
How to Trade In Stocks
Nicolas Darvas
How I Made $2,000,000 in the Stock Market
Mark Boucher
The Hedge Fund Edge: Maximum Profit/Minimum Risk Global Trend Trading Strategies (Wiley Trading)
Dave Landry
Dave Landry's 10 Best Swing Trading Patterns and Strategies
Richard Love
Superperformance stocks: An investment strategy for the individual investor based on the 4-year political cycle
Charles Kirkpatrick
Beat the Market: Invest by Knowing What Stocks to Buy and What Stocks to Sell
Michael Carr
Smarter Investing in Any Economy: The Definitive Guide to Relative Strength Investing
Saturday, February 11, 2012
DC's Percolator Scan
DC's Percolator Scan will be used to find stocks, which are closed to 6 month high and just break out on the scan day. This kind of stocks will also likely be shown in other scan, such as EP scan or STIB. The original post can be found here.
The criterion are as following:
1.Today’s percent change >= 2%
2.Today’s volume surge >= 50% (volume surge is calculated based on 100MA of volume)
3.Within 10% of 6 month high
4.C1 Percentchange <= 4
5.C2 Percentchange <= 4
6.C3 Percentchange <= 4
7.C4 Percentchange <= 4
This list is sorted by volume surge from highest to lowest. Now, we have all stocks starting to move on potentially higher volume within 10% of their 6-month high with no breakout days in the past 4 days.
In telechart or tc2000, the scan formula is
c>=1.02*c1 AND V>=1.5*AVGV100.1 AND C>=0.9*MAXH120.1 AND C1<=1.04*C2 AND C2<=1.04*C3 AND C3<=1.04*C4 AND C4<=1.04*C5
Usually you can find out many good setups using this scan.
Sunday, February 5, 2012
Toby Crabel and his day trading method
If you want to be serious day trader you must study the work of Toby Crabel . He wrote a book Day Trading With Short Term Price Patterns and Opening Range Breakout some years back and now it sells for 300 plus dollar on Amazon. You don't need to buy the book but if you search for his name you will see several sites describing his concept of narrow range day. Nr4 and Nr7 have now become common lexicon due to his book. Essence of his idea is that when range contracts it signals a possible volatile move on either direction.
http://traderfeed.blogspot.com/2007/03/toby-crabel-and-epistemology-of-trading.html
Link to download the book by Tony Crabel:
http://www.filestube.com/4c46a8d6894b841e03e9/go.html
Bright Trading strategy
Moo= market on open order Loo= limit on open order. If you have not heard of these then you are not true day trader
Stockbee's narrow range pre-breakout scan
This is very close to the idea of dragon scan. We want to find those stocks which have a first stage breakout going to be hyperbolic. Then the stocks had a narrow range consolidation period. Usually these stocks will have high probablity breaking out after the consolidation.
Some of stocks satisfying these criterions after Friday's close are CIE, PXP, CTAS. SWS is an example which had a breakout on this Friday.
one of the ways to do this is take a momentum list of say top 200 or 300 stock by MDT (c25/avgc126.25) and then sort it by a short term momentum scan like say c/avgc10 or/and c/avgc20 and then look at those with lowest values. They show stocks that have longer term momentum but having shorter term pullback/ consolidation.
Subscribe to:
Posts (Atom)