Market was down more than 1 percent on the Friday. But there is no fear and major damage so far. People are optimistic for the market even though the US employment data was reported below expected on Friday. I am also optimistic even though my 401k was down 1 percent also. I feel this should be a good dip buying opportunity. The market could dip even more early next week, but I feel it will come back.
So far I am holding three positions, BWLD, CRUS and LCC. There first two are under water for around 3 percent, which I bought on Thursday hoping for a follow through break out. I do not worry too much for the first two, as they are having good fundamental and charts are in consolidating mode. When market is good, they will break out.
LCC is a good trade so far. I was up 4 percent intraday, but the profit faded. Hopefully I can see continuing upside in LCC.
Sunday, July 8, 2012
Friday, July 6, 2012
TNA method from BH
http://fivetrades.blogspot.com/2012/06/tna-method.html?m=1
BH introduced a TNA method, which is discussed in Stockbee forum in the past year. Based on the previous performance, it is a reliable method to trade TNA and timing entry for 401k.
BH introduced a TNA method, which is discussed in Stockbee forum in the past year. Based on the previous performance, it is a reliable method to trade TNA and timing entry for 401k.
Wednesday, July 4, 2012
新人必看书籍 trading books from Mitbbs
TA方面的书籍这本非常不错,请你至少看3遍,网上有PDF.
《Technical analysis of the financial markets》
FA这本不错,网上也有PDF:
《Intermarket Analysis - Profiting from Global Market Relationships》
其他书籍及阅读资料:
http://www.maofou.com/ (中文网站)
http://traders-library.com/download/ (英文PDF书籍)
The above links contains tons of trading books. I even find the pdf file for the classical market breadth book written by Greg Morris. Super nice finding today.
Back for trading
My trading activities were very limited from May due to the market behavior. On June, I only made three trades. All the three trades were losing trades, which I stopped out next day, then were up 10 percent in the next two or three days. I felt the market were in some range and not very tradable for person like me with a full time job.
Now we are in July. Market starts showing the consistent buying in the past few days. The market breadth is dramatically impoving from April. Now it is a good time to trade for breakout setup, look for good intermediate term investment opportunities.
I moved my 401k into funds instead of cash on July 2nd. I will look for trading for setup.
Happy July 4th.
Saturday, April 28, 2012
Value in Time: Better Trading through Effective Volume
Value in Time: Better Trading through Effective Volume
Today I come across ChartMill.com, there is an interesting article about the Effective Volume. The idea of Effective Volume was described in the book ‘Value in Time‘ by Pascal Willain.
Chartmill had a good scan to implement this idea. http://www.chartmill.com/documentation.php?t=Effective+Volume+%28explanation%29. I see this scan shows many good stocks with good risk-reward entry. Currently, many stocks are having good accumulation in the past 4 days. They all have good follow-through from breaking out the high or bounce from 50MA.
The Effecitive Volume idea is worth to be implemented in TC2000.
The book can also be found online at http://www.4shared.com/document/2fD1UvbA/Value_in_Time_Better_Trading_T.html
Wednesday, April 25, 2012

Saturday, April 7, 2012
Best Stock Market Indicator Ever: Weekly Update (zz)
http://advisorperspectives.com/dshort/guest/John-Carlucci-Best-Indicator-Ever-Update.php
The $OEXA200R (the percentage of S&P 100 stocks above their 200 DMA) is a technical indicator available on StockCharts.com that can be used to forecast conservative entry and exit points for the stock market.
The OEXA is used to find the "sweet spot" time period in the market when you have the best chance of making money.
Wednesday, April 4, 2012
Dow seasoning performance

April is best month for the Dow. The Dow industrials have seen strong rallies
during the first month of spring. From 1971 to 2011, the Dow’s percentage gain in April months totaled 93.2%, with an average of 2.3% each year.
Source: Stock Trader’s Almanac 2012
LULU and RAX trades
Yesterday after the FED meeting minutes released, market began to sell off. But it was interesting that a lot of strong stocks went up and held very well in the yesterday session. For example, MDVN was up almost 7 percent, URI, GNC, LULU and RAX. These strong fundamental stocks did very well. Hence I was eluded that these good stocks would be hold well or have tiny dip even though market had a coming correction. I am totally wrong which turns out today.
It is funny that I bought RAX yesterday around 2:00pm before the FED meeting minutes released. I totally forgot what would happen. At that time, RAX seemed to have a coming breakout. Then bang, it started to sell off after the FED meeting, but came back nicely by the end of session. But today, RAX had a 4% downside. I am still holding this losing position. Another naive mistake for me. I thought setting a market order at 9:30pm to cut my loss for RAX and LULU. But due to the good fundamental of these stocks, I did not set my stop. Today, I saw RAX dived hard. LOL, I did not have these bad trades for a while. I thought I had a good risk management recently, but I still made the mistake. What did trigger my mistake today? I think it is the big gap down at the open. My entry for RAX was 59, but it was open at 58. I did not want to take the quick overnight 1 dollar loss, so the bad downside came.
Today it is a good lesson to remind me how to stick to the rule and have a good risk management.
Monday, April 2, 2012
读直觉交易商的启示
The Intuitive Trader: Developing Your Inner Trading Wisdom
直觉交易的高度能涵盖市场纵横面的抽象思维,它更具直观性,糅合了与生俱来的感性与后天培养形成的习惯思维模式,着力用精确的意识能力去对过往和未来动态市场内在规律作出判断。直觉偏于全局概括化,交易策略与技巧似乎附属直觉思维,但含杂着理性的意识,相互对立,却又无不联系。但它称不上体系。严格意义来讲,自康德、黑格尔以后就没有所谓的体系了。对哲学的理解,体系更偏于浩瀚,直觉理论不过是放在哲学范畴中式微的部分。相当于承钵与嗣出的关系。我姑且把直觉交易当成哲学交易,这似乎上升到一个深质的境界,对投资市场的认识更为统筹。
在我接触过书籍之中,库佩尔与约翰.玛吉的著作对心理学与哲学交易相似颇多。库佩尔强调遵从左右大脑半球的行为模式与合乎逻辑的思考,从而释放出大脑右半球的直觉智慧。玛吉的阐述事态的变化更具有运动性和动机性。从外面世界的观察引动到大脑对储存信息反馈的互动连锁。他提出一一种价值观,是人的自我控制和生存需要,随即推出多元值系统和无穷值的思考。这似乎超出了投资本身的意义,把市场高度概括达到无法理喻的程度。其实,我们不必要去探索太过抽象的东西,玛吉的《战胜华尔街》是过40岁后再去研究的课题。他的另一本《股票趋势技术分析》倒是开宗明义,经典易读,那部书籍完全适合我们现有投资者。
我对直觉的理解更倾向于本能意识,但这又需要后天心灵的磨练与积累的经验。这些后天打磨的信仰会融入你本身不可或缺的习惯,成为一种印烙在你内心与外界相应互动的天性。直觉又有理性和感性之分。从感性来说,我比较欣赏美国作家亨利.米勒的本能写作,这种在文学上叫意识流。随意识而动,介于意识与潜意识之间的梦呓、幻觉,无拘束甚至疯狂自由联想及词语的任意排联组合,不受意识控制状态,心灵凭本能出发,直击事物的本质。这抛开了事物表象掩盖的薄纱,摒弃存在真实旁支的假相,直接看到更为真实的刚体。投资市场是需要本能化的交易,但对太过感性的本能只适合文学艺术的创作,我所要的本能是介于感性与理性的媒质。我取决于混沌性。我想从后来直觉交易商的实例,那种理性的本能交易才是我们最需要掌控的。我先对比尔.威廉姆斯博士杰出的混沌学交易商的直觉方法作个剖析。
查理.D曾经说过,技巧一上身,心就忘记它。从我们初涉投资交易开始,技术就是我们从事交易训练的必须课程。从事期货多年,让许多人对技巧与策略更为偏颇,甚至养成了依赖。各项图表,技术指标及道氏理论,波浪理论等机械性工具让我们在市场的环境变化中作出理性的判断。其实市场交易的立足在于市场动态行为的本身,它涵盖足够的信息量,包括人性心理,基本面的变化,资金动态等。我们所能运用的各项指标与理论,无非是人类根据市场信息构成的趋势演变的路径,运用意识去整理和归纳市场长河内在的源头,以便甄别市场动态发展的方向。
比尔博士的观点是排斥大脑左半球的自我和主观意识,把所有你接触的信息量汇集于一点,腾挪于市场之中。你的交易是无意识的,技巧就像骑自行车那样不需想应该从哪道程序开始着手。在熟练程度在大脑形成一定的储积,你的心就会忘记你所要做的工作,自然而然处理要掌握的平衡点。
学习过程不是一蹴而就,比尔博士把它们分为五个阶段。第一阶段是先从市场学习经验,努力做到不赔钱。但往往是事与愿违,起步很难,刚开始对市场的反应是情绪被左右,心中跌宕起伏,完全处于被动挨打局面。基本以亏钱为主。
第二阶段,你的观点出现了看法。你会审视自己的交易行为,熟悉交易步骤的连贯性。当你赢得第一笔利润时,你会发觉交易不是随机作业,是程序运用正确得出的结果。
第三阶段,比尔叫它胜任阶段。非常个性化地从事好的交易活动。你手法熟练,能在市场游刃有余,赢多输少,市场成为你一部分。这好比你是个冲浪者,你冲出去,只是凭直觉知道下一个大浪从那来,以及你应该从应该怎样冲上浪尖。毫不费力地随波逐流。
第四阶段,反应个人特色。就像弹钢琴,你不会按乐谱的标准弹,音节随着你的理解抑扬顿挫,你会在弹的过程中加入自己的感受和直觉。你知道什么是正确交易,但不清楚自己是怎么知道的。没有什么刺激你参与,而是你看到了,然后自动加入,一切都是自然发生,没有犹豫。
第五阶段,比尔称之为专业阶段,交易占据大脑右半球,完全是直觉交易。这与其他体育竞技或其他任何领域的专业活动一样。市场的交易已经成为你所能控制的对象,你知道如何协调你的交易行为。
比尔在这里教了个很好的直觉训练方法,比如在早晨做任何其他事情之前,你首先应坐下来,写上三页纸。你写什么都没关系,只要你脑袋里想到什么就写什么,那只是纯粹的意识流。每天坚持,长久下来你的洞察力会逐渐提高,对市场的敏锐度会相应加强。最高水平的交易就是纯粹的思考经验。
忠于自己,比尔告诫,在市场出现错误的交易行为,就不要为自己辩解和编造理由,这是致命的。你只有直视事态本质的变化,才能获得真实的市场直觉。
Wednesday, March 28, 2012
The Improved R2 Strategy: 84% Correct with Just 6 Rules (zz)
http://www.tradingmarkets.com/.site/stocks/commentary/editorial/The-Improved-R2-Strategy.cfm
http://www.tradingmarkets.com/free-tools/rsi-solver
In early 2005, we published the R2 Strategy on TradingMarkets
which quickly became one of our more popular strategies. The strategy was also
presented at "The Traders Expo" in Fort Lauderdale last year. In the "MoneyShow.com
Best Webcasts of 2006" it was voted the number one presentation in the "Best for
Traders" category. We recently updated and improved our research, leading
to this article that shares our latest findings with you.
What is the Improved R2 Strategy?
The Improved R2 Strategy is a simple six-rule Market Timing Strategy
which uses the 2-period RSI as its primary tool. Our research has shown that
there is little statistical evidence using the standard 14-period RSI. But, when
you shorten the period to a 2-, 3- or 4-period RSI, test results significantly
improve. By using the 2-period RSI as we do here, you can see back-tested
results of 84.31% correct in the S&P 500 Index going back to 1995 (12 years).
Here are the Rules:
The SPX is above its 200-day simple moving average (you can use any S&P 500 derivative product, including the SPYs, E-minis, etc).
Day 1 - the 2-period RSI is below 65. This tells us that the market is in a neutral to possibly
oversold condition.
Day 2 - the 2-period RSI closes lower than Day 1.
Day 3 - the 2-period RSI closes lower than Day 2.
Buy the market (SPX, SPY, E-mini, etc) on the close Day 3.
Exit when the 2-period RSI closes above 75.
Sunday, March 18, 2012
Online stock books search engine and some stock books to download
Today I found a very good website to search for stock books online which are uploaded by others to online storage websites, such as Rapidshare, Hotfile, etc. It is
http://www.rapidsharemix.com/
Some of good stock books to download:
1. A Trader's Money Management System: How to Ensure Profit and Avoid the Risk of Ruin (Wiley Trading)
http://www.mediafire.com/?tmdkdxn51ml
2. The Psychology of Trading: Tools and Techniques for Minding the Markets by Brett N. Steenbarger
http://www.mediafire.com/?gpwtdzgrzeu
3. Trade Chart Patterns Like the Pros: Specific Trading Techniques by
Suri Duddella
http://www.mediafire.com/?fnqan3m3c8r5np3
4. The Master Swing Trader by Alan Farley
https://rapidshare.com/#!download|81p12|133053428|The_Master_Swing_Trader.pdf|7506|R~42718BF4A5FB41930B6C16D3DBFE4E2A|0|0
5. Investment Valuation 2nd Edition University with Investment Set by Aswath Damodaran
https://rapidshare.com/#!download|339p12|60162974|Investment_Valuation_-_Damodaran.pdf|3949|R~0|0|0
Wednesday, March 14, 2012
possible way to spot the market top
There are several ways to spot a potential market top. One way is to see the action of past momentum stocks. If the market tops, those momentum stocks should have wide range and started to break down or forming some header/shoulder, double top pattern. A lot of selling can be seen during past several days if market tops.
Look at the universe stocks with the liquidity condition, use MDT month ago to sort the stock list, then look at the action of the top 100 momentum stocks. At current stage, a lot of momentum stocks are holding very well and in some kind of sideway moves. They do not have any sign of breaking down. This indicates that currently market is in a pause stage lack of momentum. If there is a good upside thrust, market will continue going up.
Look at the universe stocks with the liquidity condition, use MDT month ago to sort the stock list, then look at the action of the top 100 momentum stocks. At current stage, a lot of momentum stocks are holding very well and in some kind of sideway moves. They do not have any sign of breaking down. This indicates that currently market is in a pause stage lack of momentum. If there is a good upside thrust, market will continue going up.
Tuesday, March 13, 2012
Look at some charts for short squeeze
I think the following setup is also a good winning strategy. It is looking for short squeeze. The idea is that, the day before everyone wanted to short the stocks. Hence many traders held the short position over night. The next day, the market gapped up and had some good news. The stocks gap up next day and allure new buyers to buy. Then the short sellers had to cover which would push the stock price even higher. This situation can be happened at a double bottom case, or some level to form a higher low.
The following chart is CIEN. On 03/09, it traced back to 20MA on lower volume. I shorted CIEN from 03/09. The next day 03/10, the stock had a pullback. Yesterday it was very temping to hold the short position overnight. Then today CIEN squeezed hard to be up 7.34%. I had thought about this situation, because I saw the down volume yesterday is very thin. It looked to me that not much selling yesterday. Hence I closed my short position yesterday. CIEN can either dive hard today or squeeze hard. This setup always depends on the trader's risk management. You can be wrong, but correct yourself at no time.


The following chart is CIEN. On 03/09, it traced back to 20MA on lower volume. I shorted CIEN from 03/09. The next day 03/10, the stock had a pullback. Yesterday it was very temping to hold the short position overnight. Then today CIEN squeezed hard to be up 7.34%. I had thought about this situation, because I saw the down volume yesterday is very thin. It looked to me that not much selling yesterday. Hence I closed my short position yesterday. CIEN can either dive hard today or squeeze hard. This setup always depends on the trader's risk management. You can be wrong, but correct yourself at no time.


Dark Liquidity
http://www.dark-liquidity.com/homepage.php
A very interesting site containing a lot of useful information about the trading. Definitely worth to take a look.
A very interesting site containing a lot of useful information about the trading. Definitely worth to take a look.
Sunday, March 11, 2012
Back from Stockbee Bootcamp
I attended the Stockbee bootcamp for this weekend. What did I learn from this bootcamp?
I think it is the idea of range expansion. It includes breakout setup from a range, relex bounce from an oversold downtrend, bounce from support or moving average, and many others you can name. It assumes that if a stock breakout from some range on day 1, it will be likely to go same direction as the breakout direction in the next 2 to 3 days. The fundamental idea of each trading setup is simple. They can all be clarified as some form of range expansion.
How to earn money in stock market? I feel it is vehicle selection and risk management.
How can I improve my trading? All by myself.
Tuesday, February 28, 2012
Some charts watched for reflection
AMED is a broken down stock. The momentum surged yesterday for a clean breakout. Today morning it gapped up to the highest of day, then dropped hard. People will definitely take profit when stocks gapped up huge without any news driven. This kind of trades can be taken for a quick overnight profit.
I had a similar trade for TNE on last Thursday. Last Friday TNE gapped up huge then faded. I did not take profit quickly early morning and ended up a losing trade.

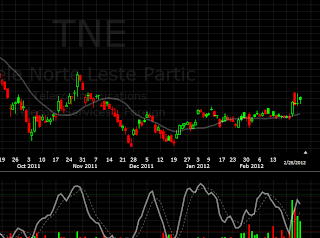
I had a similar trade for TNE on last Thursday. Last Friday TNE gapped up huge then faded. I did not take profit quickly early morning and ended up a losing trade.


Saturday, February 25, 2012
15m bounce setup looking for

This is one of the setups I noticed working from time to time. The ticker is CHRS from 02/22 to 02/23. It is a 15-minute bounce setup. The key is to look for the RSI divergence. The price is forming a double bottom or gradually flattened, but RSI is rising up but below 50 to form a divergence. The conservative entry is to enter next day early morning once the stock are showing sign of going up. Usually the upside momentum can only last for half an hour, then it may reverse hard. I think it is a good day trading method.
Another good example to show this is the AKAM in the past weeks. As it can be shown on chart, the setup is shown up on early day of 02/21, but the bounce is very weak. It gapped up then faded away to dive down. I think the intraday setup is not quite reliable. On end day of 02/23, the 15m bounce setup came once again. And this time it works. I guess it due to that AKAM touched the 20EMA on daily chart. Traders still weight a lot on the support on daily chart.

Another example in KBH

How to implement this in Telechart or TOS to find this kind of setups? In TOS, my implementation is as follows:
Lowest(rsiWilder(14), 52)<=20 and rsiwilder(14)<=50 and rsiWilder(14)>=40 and SimpleMovingAvg(close, 20) * SimpleMovingAvg(volume, 20) >= 250000
Some of these setups from the scan by Friday:
BRCM, VTR, TLAB, UN, EAT, CWH, ADTN
potential setup for next Tuesday or after (maybe):
MPC, ERF, CDE, WMS,
Monday, February 20, 2012
Trading the S&P 500 After An Overbought Period Ends – Using the Percentage of Stocks Trading Above Their 40DMAs by Dr. Duru
http://drduru.com/onetwentytwo/2012/02/19/trading-after-overbought-period-ends/
T2108, the percentage of stocks trading above their 40-day moving averages (DMAs).
Here are the fundamental conclusions I generated from analyzing the S&P 500′s behavior between overbought periods since 1986. For convenience, I will call this the “interim period.”
Extended rallies are typically characterized by a series of overbought periods.
There is no relationship between the duration of the overbought period and the maximum loss before the next overbought period. However, the largest losses have all occurred after overbought periods that lasted 20 days or less. After longer overbought periods, the maximum loss during the interim period has been 10%.
There is also little relationship between the length of the interim period and the maximum loss during that time. However, losses of 10% or greater have ALL occurred when the interim period lasted between 50 and 155 days.
After excluding interim periods that included oversold periods, there is a stronger relationship between the duration of the interim period and the maximum loss. The vast majority of interim periods have lasted less than 50 days.
Given these observations, traders should treat rules for trading between overbought periods as general guidelines. The risks are worth the rewards IF traders size positions modestly, prepare to make multiple trades, take at least some profits after moderate declines, AND stop out by the time T2108 has begun a new overbought period.
Specifically, traders should follow these guidelines:
Short early but in moderate size once an overbought period begins.
Never build a “full” trading position just in case the overbought period lasts longer than 20 days, and/or reduce the size of the bearish position after 20 days. Hedging against the bearish position counts as a reduction in risk.
Start taking profits no later than a decline of 5% or so on the S&P 500 during the interim period. Stop out by the time the next overbought period begins.
Sunday, February 19, 2012
一次读完30本经济学经典
Download link: http://fp.io/2d86cam5/
本书列举了30本历代经济学大师的传世巨著,这些经典之作,不仅在当时的社会背景下.为人们解决了一个个复杂多变的棘手的经济问题,推动了人类历史的进程,而且在21世纪的今天,我们仍能从这些大师身上学习到宝贵的经验与智惹,来解决当前所面临的各种问题。
编者用最简洁的语句,为你讲述伟大作品的精华。用最浅显的文字,连释大师们的深邃。用最好住的字句,传递原著中令人难解的理论。期望让读者在最短的时间内,了解每一位大师给予我们的忠告和教诲。
本书目录
第1部 《经济表》
第2部 《国富论》
第3部 《人口原理》
第4部 《政治经济学概论》
第5部 《政治经济学及赋税原理》
第6部 《政治经济学新原理》
第7部 《政治经济学的国民体系》
第8部 《政治经济学原理》
第9部 《资本论》
第10部 《政治经济学理论》
第11部 《国民经济学原理》
第12部 《纯粹政治经济学纲要》
第13部 《资本与利息》
第14部 《经济学原理》
第15部 《利息与价格》
第16部 《财富的分配》
第17部 《有闲阶级论》
第18部 《经济发展理论》
第19部 《福利经济学》
第20部 《不完全竞争经济学》
第21部 《就业、利息和货币通论》
第22部 《价值与资本》
第23部 《通往奴役之路》
第24部 《经济学》
第25部 《丰裕社会》
第26部 《经济成长的阶段》
第27部 《人力资本投资》
第28部 《资本主义与自由》
第29部 《经济学》
第30部 《经济学原理》
Monday, February 13, 2012
How to Look for and Trade Earnings-Related Breakouts from Chart Swing Trader
A great post about PEAD written by Chart Swing Trader.
http://www.chartswingtrader.com/2008/05/how-to-look-for-and-trade-earnings.html
http://www.chartswingtrader.com/2008/05/how-to-look-for-and-trade-earnings.html
Sunday, February 12, 2012
Essential Books for growth and momentum traders listed by Stockbee
Stockbee listed the following list of Essential Books for growth and momentum traders. I will post links to download these books later.
William O'neil
Read all editions of O'Neil book starting with First Edition
How to Make Money in Stocks: A Winning System in Good Times and Bad, Fourth Edition
The Successful Investor: What 80 Million People Need to Know to Invest Profitably and Avoid Big Losses
How to Make Money Selling Stocks Short (Wiley Trading)
24 Essential Lessons for Investment Success: Learn the Most Important Investment Techniques from the Founder of Investor's Business Daily
How To Make Money In Stocks: A Winning System in Good and Bad Times-
Jesse Livermore
Reminiscences of a Stock Operator (Wiley Investment Classics)
How to Trade In Stocks
Nicolas Darvas
How I Made $2,000,000 in the Stock Market
Mark Boucher
The Hedge Fund Edge: Maximum Profit/Minimum Risk Global Trend Trading Strategies (Wiley Trading)
Dave Landry
Dave Landry's 10 Best Swing Trading Patterns and Strategies
Richard Love
Superperformance stocks: An investment strategy for the individual investor based on the 4-year political cycle
Charles Kirkpatrick
Beat the Market: Invest by Knowing What Stocks to Buy and What Stocks to Sell
Michael Carr
Smarter Investing in Any Economy: The Definitive Guide to Relative Strength Investing
Saturday, February 11, 2012
DC's Percolator Scan
DC's Percolator Scan will be used to find stocks, which are closed to 6 month high and just break out on the scan day. This kind of stocks will also likely be shown in other scan, such as EP scan or STIB. The original post can be found here.
The criterion are as following:
1.Today’s percent change >= 2%
2.Today’s volume surge >= 50% (volume surge is calculated based on 100MA of volume)
3.Within 10% of 6 month high
4.C1 Percentchange <= 4
5.C2 Percentchange <= 4
6.C3 Percentchange <= 4
7.C4 Percentchange <= 4
This list is sorted by volume surge from highest to lowest. Now, we have all stocks starting to move on potentially higher volume within 10% of their 6-month high with no breakout days in the past 4 days.
In telechart or tc2000, the scan formula is
c>=1.02*c1 AND V>=1.5*AVGV100.1 AND C>=0.9*MAXH120.1 AND C1<=1.04*C2 AND C2<=1.04*C3 AND C3<=1.04*C4 AND C4<=1.04*C5
Usually you can find out many good setups using this scan.
Sunday, February 5, 2012
Toby Crabel and his day trading method
If you want to be serious day trader you must study the work of Toby Crabel . He wrote a book Day Trading With Short Term Price Patterns and Opening Range Breakout some years back and now it sells for 300 plus dollar on Amazon. You don't need to buy the book but if you search for his name you will see several sites describing his concept of narrow range day. Nr4 and Nr7 have now become common lexicon due to his book. Essence of his idea is that when range contracts it signals a possible volatile move on either direction.
http://traderfeed.blogspot.com/2007/03/toby-crabel-and-epistemology-of-trading.html
Link to download the book by Tony Crabel:
http://www.filestube.com/4c46a8d6894b841e03e9/go.html
Bright Trading strategy
Moo= market on open order Loo= limit on open order. If you have not heard of these then you are not true day trader
Stockbee's narrow range pre-breakout scan
This is very close to the idea of dragon scan. We want to find those stocks which have a first stage breakout going to be hyperbolic. Then the stocks had a narrow range consolidation period. Usually these stocks will have high probablity breaking out after the consolidation.
Some of stocks satisfying these criterions after Friday's close are CIE, PXP, CTAS. SWS is an example which had a breakout on this Friday.
one of the ways to do this is take a momentum list of say top 200 or 300 stock by MDT (c25/avgc126.25) and then sort it by a short term momentum scan like say c/avgc10 or/and c/avgc20 and then look at those with lowest values. They show stocks that have longer term momentum but having shorter term pullback/ consolidation.
Sunday, January 29, 2012
From Lasertrader: Using PEAD (Post Earnings Announcement Drift) To Give You An Edge
http://lasertrader.wordpress.com/2012/01/21/using-pead-post-earnings-announcement-drift-to-give-you-an-edge/
A great article from Lasertrader about PEAD.
Although I had been trading for some time, I always had the same struggle many traders have. This is the challenge of how to build the best list of stocks to trade to increase your odds of being in a successful trade. As a technical chart pattern trader I look for certain chart patterns that offer a high probability of success if the pattern is broken in a positive way (for longs) or a negative way (for shorts). Finding these patterns has become very easy these days. Just watch the charts that are continuously posted by traders on the Stocktwits stream. There are so many there that look good we should all be rich and famous. In fact, there are so many to choose from where do you start? You can’t possibly trade them all.
If you have been trading technical chart patterns for a while you realize that in may cases the patterns that looked so good in advance failed miserably shortly after you got into the trade. As an example, in 2008 Thomas Bulkowski studied the failure rate of 14,000 “long” chart patterns in the Bull Market of 2003 to 2007 and found the failure rate to be 28%. To be successful as a technical trader you need to define an edge that works for you. The edge is a method of building a list of stocks to trade that will increase the probability of the technical pattern playing out in your favor. If you just randomly grab chart setups off Stocktwits, most likely Murphy’s Law will prevail on the stocks you choose to trade and those will be the patterns that fail. There are many methods you can use to get your edge. Maybe you trade stocks in strong sectors. Maybe you jump on news stories. Maybe if in the upcoming State of The Union Address the President mentions some sector focus for the coming year and you look to trade the stocks in that arena. Maybe you just have a set list of stocks that met some criteria you defined and trade technical setups on just that list. My core list and what I feel provides my edge is based on the PEAD concept.
PEAD stands for Post Earnings Announcement Drift. I was first introduced to the PEAD concept several years ago by Pradeep Bonde when I joined the Stockbee Service where the focus is on developing solid methods for being successful at trading. The PEAD concept was first described in a 1968 academic accounting research paper by Ball and Brown and further explored in detail in a 1989 paper from Bernard and Thomas. I will provide some additional links to articles about PEAD for you to explore at the end of this post but the basic premise of PEAD is….
“Post Earnings Announcement Drift (PEAD) is the tendency for a stock’s cumulative abnormal returns to drift in the direction of an earnings surprise for several weeks (even several months) following an earnings announcement.”
If there is an earnings surprise and the stock pops up, it has a high probability of continuing that move up for quite some time. When I thought about PEAD as an edge it just seemed so intuitive. Since, in my mind, the driver of most longer term moves in a stock price is usually growth in revenues and earnings, why not make upside earnings surprise the core strategy of defining your edge? For the past few years I have defined my core strategy as being PEAD based and I built my list of stocks to look for technical setups from those that have had earnings surprises and price pops as a result. Once I have built the list I will watch those stocks daily waiting for them to set up a continuation pattern to trade such as a horizontal consolidation or flag.
Being successful at trading is not easy, it takes hard work and lots of preparation. Once you define your “edge” also known as your method, you need to do the work every day to find only the best trades to deploy your assets in. One way to start implementing the PEAD concept is by using the Earnings Whispers site. Even without a premium subscription you can visit the site or subscribe to a free email that tells you the earnings beats or misses for each day. Then it’s up to you to track those that had a surprise beat or miss for follow on setups. If you search you will find earnings data from a variety of sites and services out there.
Recently I have been using a premium service from The Patient Fisherman called Bluefin to save me time in building the PEAD list. In Bluefin they are called the Post Earnings Surprise lists. Bluefin provides two lists that are continually updated. The first list contains stocks that in their most current earnings announcement they exceeded the analysts earnings per share (eps) estimate by at least 25%. The second list contains stocks that had a price move of 6% or more on the day of their earnings (with The Patient Fisherman’s permission, here is the 6% list published on 22 Jan 2012). I have found these two lists to provide more than enough opportunities to trade on a regular basis. I start with these lists and filter them so that I only have stocks that are over a minimum price and trade on average a certain amount of shares per day. Once the list is narrowed down I review it every day and set trading alerts on the best technical setups I can find that match my style.
Here are a few examples of stocks on the list that show successful follow on technical setups.
The above stocks are just a few of a large list. Not all work out as planned but if they trend and set up technical entries the PEAD effect increases your odds of having the trade be a profitable one. If you start making a list and monitoring the PEAD stocks you will find that they are often mentioned by others over time after they make a continued move. By doing your homework and monitoring the list each day you will be in the higher probability setups.
If you search the internet you will find many articles discussing PEAD. Here are a few to start with.
From Stockbee’s public blog
Earnings Season and the Cinderella Strategy
Paul Tudor Jones and Episodic Pivots
From Phil Pearlman’s Stocktwits Blog
Apple, Intel and Post Earnings Announcement Drift
From Matthew Weinschenk at Investment U
Using the Post-Earnings Drift: How to Find Stocks Set to Surge in Two Easy Steps
Regardless of whether you incorporate PEAD into your strategy or not, the most important thing is that you define your edge and have your own methodology to find the proper stocks to trade and the proper entries, exits and stops. Random approaches do not work and following others does not either. Be a professional and treat this as a business. The harder and smarter you work the luckier you get.
Subscribe to:
Posts (Atom)