Saturday, December 31, 2016

December 2016 Trade Review

Summary:

1. short term price momentum remain short. It may just sustain to next day morning up to 10am.
2. take profit when I feel pleased.
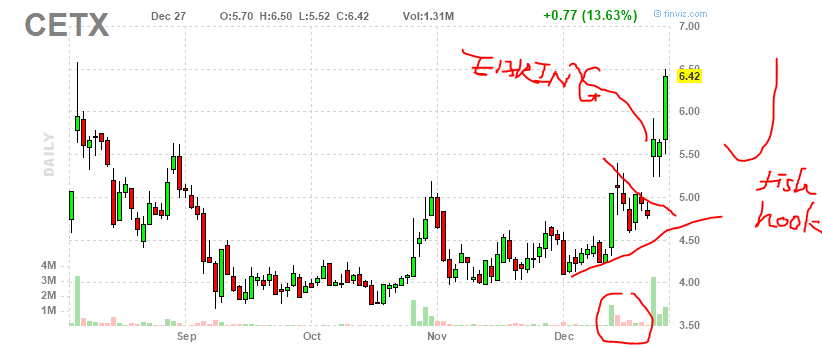
3. fishhook setup worked well for low float and momentum stocks.
4. set stops at the low of the breakout bar. Do not move stop. Take small loss instead of large.
5. for good fundamental stocks such as AKAM, INCY, it is a dilemma whether taking small loss or set stop when losing 8%. Right now I feel it is still better taking small loss, since market is predictable. What if they broker 50MA and market tanked as in January 2016? So rather be protective.
6. buy high and sell higher! look for momentum stocks instead of small move


Winning trades:


Closed lose trade


Open positions:


additional position for HDSN, SWC, SGYP, IMGN.

Friday, December 30, 2016

Example and lesson from a range expansion from below set up

Below are 2 examples.

1. LXU: I noticed LXU this week, the entry can be around 9 dollar. Next day morning it went up sharply a little bit off previous high, end dived down. The upside momentum only hold around 1 hour next day as shown in the 5 minute charts. Lesson: take profit as long as you can.

2. HDSN: I actually traded HDSN. My entry is around 7.66 yesterday. Today HDSN went up to 8.45 in the first hour. That is around 10% gain overnight. It is the similar behavior as LXU. I did not take the quick profit and still hold it. Luckily HDSN hold the 8 dollar area. 

HDSN is a strong growth stock as I scanned it based on fidelity screener. I think this stock will continue going up in 2017. That is the reason I did not take the quick profit. Hopefully HDSN will do good next week.


EP, STIB and RSI power list for week 2016-12-26 to 2016-12-30

Weekly RSI >=65 and volume surge at least 50%

http://finviz.com/screener.ashx?v=211&ft=3&ta=0&t=CNAT%20FRED%20NAK%20HIIQ%20LIVE%20DRAM%20FRBK%20KEM%20OTIV%20CETX%20GV%20CDZI%20NVDA%20EMD%20PME%20HOFT%20CNAB%20LUKOY%20FFIN%20PIP%20SMI%20CFFN%20FRA%20HCAC


EP list

http://finviz.com/screener.ashx?v=211&ft=3&ta=0&t=BAS,IDXG,CNAT,HIIQ,MPET,LIVE,CVI,CETX,CRC,NVDA,BCRX,PGNX,MU,CVRR,LXU,CO,WATT,PTLA,GLP,WMK,ITCI,TSLA,SGYP,CARA,CZR,WTW,FLXN,ALXN,SUN,KATE,AMZN,AGN,ZAGG,MBLY,AVXS,ONCE,AGI,ICPT,AG,TAHO,PVG,SLW,FSM,NLNK,MAG,SHLD,RIC,JUNO,AAAP,XBIT,GOL,ELGX


STIB list

http://finviz.com/screener.ashx?v=211&ft=3&ta=0&t=BAS%20CNAT%20AKAO%20NVCN%20NAK%20HIIQ%20VBIO%20MPET%20LIVE%20DRAM%20GSAT%20IPI%20PES%20AMD%20CVI%20CETX%20GV%20CRC%20NVDA%20BCRX%20HOS%20FMSA%20PGNX%20MU%20LPG%20CDEV%20CVRR%20CRR%20VCEL%20CF%20IEP%20LXU%20WATT%20FBR%20HCLP%20SALT%20PRTK%20WMK%20CALM%20PTCT%20EXAR%20BSBR%20SMI%20MFS%20TSRO%20CRK%20CARA%20HDSN


Tuesday, December 27, 2016

CETX and CNAT example of fishhook setup

I closed my half position on CETX at 6.37. There is a clear wedge with volume decreasing, then gap up due to the earning release. This is a good growth stock. It did not fly on the earning day and went down to 5.25. At that time, I wondered if I was wrong and if I should close my position. I thought not and wanted to add some more position since I was pleased with the earning number. However, I did not add my position. Yesterday the stock went low again to test 5.3 area then flied during today's session. This is an example of SOS's fishhook setup on the 15/30/60 minutes charts. I wish to see this stock go up to 7 area tomorrow.

I think CETX has bring future. I will buy low and keep this stock in my long term long list in year 2017.


Another example is CNAT. It went up due to news on collaboration with Novartis. I bought at 4.4 and sold at 4.9 on the days of news. Then in the next 2 days, the stock pulled down for two days, then flied last Friday and today. This is another example to show the price momentum of fishhook setup. I did not trade the rebound. I regret missing the run. I should risk a small position here. I think the reason I did not buy is I wished to buy at a low price at 4. Next time, when having such set up in future, risk a small position, the rewards is tremendous. The stop is at the low.


there are some range expansion upside setup which is not reliable long setup. Most of them are rebound from some support area. The upside momentum is short. When reaching some area, the old buyer who trapped will sell.


Good setup I missed. CF and OTIV. The reason OTIV is a good setup is due to the volume surge on the breakout bar yesterday. Today OTIV has follow through today. It may go to the 1.8 area tomorrow. There should be some imagination.

I saw CF 3 trading session ago since it had a range expansion. Since the volume is not significant, I passed it. Last Friday and today are good days for CF.


Saturday, December 24, 2016

EP and STIB list for week 2016-12-19 to 2016-12-23


Weekly List

Weekly RSI + Weekly Vol Change >50% List based on Stephen Steward's method

http://finviz.com/screener.ashx?v=211&t=FRBK,HIIQ,CNAT,FRED,WTI,HOV,KEM,INVN,QUIK,MPET,GSAT,PES,HNR,ESSI,NVDA,BCRX,HEOP,NSR,TLYS,LOXO,ALIOY,CNOB,IL,MC,CDEV,EMD,OTIV,XXIA,CLVS,LOCK,CLC,IRDM,GBNK,CCXI,CETX,CLMS,AF,BEAT,FRP,SCHL,GBCI,PPBI,DIOD,SNC,WGO,TSEM,UNVR,AIMC,ATKR,AWH,BFCF,BRKS,MATW,SFNC,CBF,FSB,GLAD,UMBF,DCOM,ABCB,VASC,ICFI,PIP,APOL,OFC,SBSI,NWBI,ORA,FDX,TWI,EFR,FRA,CO,ACAS&ta=0&o=-marketcap


EP list

http://finviz.com/screener.ashx?v=211&ta=0&o=-change&t=HIIQ,FRED,INVN,MPET,CVI,BCRX,LOXO,STRP,ALIOY,IMMR,SGY,CLVS,PI,VSAR,CCXI,CETX,CLMS,ACRS,BEAT,CORE,MU,AWH,HBM,KOS,MNTX,EGLT,SUPN,WATT,AKBA,CRR,JBL,HCHC,CVRR,OCUL,CENX,RELY,TSLA,ULTA,GLP,BREW,ACAD,KNDI,CVGW,ALXN,CMG,SUN,NTES,HZNP,LONE,TWLO


STIB list

http://finviz.com/screener.ashx?v=211&ta=0&o=-change&t=XGTI,HIIQ,CNAT,FRED,WTI,BCEI,FMCC,FNMA,TDW,AKS,KEM,INVN,X,AMD,MPET,GSAT,PES,HNR,CVI,IONS,QHC,REN,BCRX,UIS,LOXO,CLF,VBIO,STRP,GATX,ALIOY,CONN,CUBI,GLF,IMMR,SGY,AMAG,LRN,CLVS,PI,VSAR,WEB,CCJ,NBR,IRDM,AGX,HDS,CCXI,CETX,CLMS,RATE,ACRS,BAK,BEAT,FBP,CORE,EDIT,EIGI,EVR,GTT,KMX,CYTK,MU,FMSA,SCS,TSEM,AWH,BFCF,IEP,TOWR,APOG,INN,MNTX,ETE,HZN,CF,EGLT,NCLH,NEOG,ARII,RAD,WATT,HCHC,CVRR,IRET,ATSG,CENX,BID,TX,ICON,ASTE,CARA,HDP,KEYW,WAC,BOOT


For trading day 2016-12-24 (Friday)

EP list

http://finviz.com/screener.ashx?v=211&ta=0&o=-change&t=AGN,PTLA,SGYP,WTW,JUNO,AVXS,CNAT,ONCE,FOLD,HIIQ,DPRX,FLXN,CARA,CZR,ACHN,NVCN,PGNX,NAK,NLNK,ARWR,ACST,ITCI,RFP,PZE,BCRX,AGEN,ECPCY,GV,CO,IMMY,OTIV,CANN,BIOA,QUIK,CNAB,ABWN,CLRB,APTO


STIB list

http://finviz.com/screener.ashx?v=211&ta=0&o=-change&t=NVCN%20HIIQ%20CNAT%20PES%20GV%20BCRX%20PGNX%20AQXP%20FLDM%20RVNC%20CYTK%20FMSA%20PTCT%20ZGNX%20AST%20XNCR%20GNCA%20HCLP%20TSRO%20CALM%20ACAN%20PRTK%20EBF%20CARA


Unusual Volume Mover list

http://finviz.com/screener.ashx?v=211&ta=0&o=-change&t=CNAT,FRED,BCEI,INVN,GSAT,PES,VBIO,ATRS,OTIV,LOCK,IRDM,HBHC,UNVR,BTUUQ,CAIXY,UBSI,CVRR,CALM,TMH,RYDAF,CTAS,ENPH,BBBY,TWI,WSM,SCMP,PGH,RFP,PTLA,INAP,HCAC,WTW,BBRY,CZR,GWR,RHT,SGYP,FINL,III,MIY,GNRT,SUN,PHYS,TTI,TKGBY,BABY,SGMO,CIOXY,TKAI,GPOR,SHLD,GNC,BITA,OVAS,ARWR,DPRX

price momentum learn from Stephen Stewart


http://stockcharts.com/public/1130973/tenpp/1

http://educsos.blogspot.com/2015/08/stewart-notes_2.html

It is called Map Syntax (MAPS), which had VIOLENT price action and optimizing it. If turned where, the momentum can last at least a few weeks. So one can be patient to hold the stock and swing trade it. Set stop at the low or middle of the breakout bar. For example.

Just Follow these 3 Rules:
1. Only Invest Above the Green Line. (250 day avg.)
2. Only Invest Above 90 Relative Strength Factor (Top 10% of All Investments).
3. The Money Wave should be < 20 and turning up (Buy in Green Zone, Sell in Red Zone).

Buy when they are coming out of the Green Zone, and take profits in the Red Zone.


It is based on weekly price momentum using weekly RSI. Besides looks for weekly RSI over 70, (which I used 65), I also require criteria: weekly volume change is at least 50% more than the moving average of 26 prior weeks. I implemented this in TD and found a lot of good examples.

Most of time, the first time a stock reach such criteria, the upside momentum is more powerful. Muathe called this first mountain setup.

 For example,

ACHN back to year 2014.


Certainly there are failures, for example PZE. It appeared a good long term breakout with volume and RSI muscle, however it failed and dived hard. So the money management is key for this strategy.


I implemented this.

for week of 2016-12-12, below is the list. We can see the performance. Most of this stocks continued trending up.

http://finviz.com/screener.ashx?v=211&f=cap_smallover,sh_avgvol_o50,sh_price_o5&t=AAN,ACAS,ACTA,ADTN,AEGN,AF,AIMC,AIT,AKAO,AKS,ALIOY,AMAG,AMBC,AMCC,ARCB,ARW,ASB,ATW,AXAS,AXS,AZPN,BAC,BAH,BANR,BCPC,BEL,BFCF,BGC,BHE,BHLB,BIO,BLK,BNCN,BNED,BPFH,BPOP,BRK/B,BRKL,BRKS,BXS,CACI,CBS,CBSH,CBU,CCMP,CDEV,CECO,CENTA,CFFN,CHE,CLC,CLH,CNOB,COHR,COLB,CPF,CPLA,CSFL,CTAS,CTS,CUBI,CVBF,DCOM,DIOD,DV,EFSC,EFT,EIG,EMKR,EOG,ERF,ESE,ESNT,ESSI,EXTN,EXTR,FBNC,FBP,FCB,FCF,FFBC,FFIN,FIBK,FMBI,FMCC,FNB,FNGN,FNMA,FRA,FRBK,FRC,FRME,FRP,FSB,FSIC,FULT,GATX,GBCI,GBNK,GEF,GFF,GLAD,GMS,GPRE,GS,GTY,H,HBHC,HEOP,HFWA,HI,HII,HLI,HLT,HMST,HOMB,HOV,HTH,HTLF,HUBB,HW,IBKC,IBOC,IBTX,ICFI,IDCC,IIVI,IL,INDB,INN,INVN,IOSP,IPHS,IPI,IRBT,IRDM,ITRI,JBHT,JBLU,JFR,JRO,KAMN,KBAL,KE,KEM,KFY,KLIC,KLXI,KNX,KOP,KRO,LBAI,LION,LIOX,LRN,LSTR,LTXB,LUKOY,MATW,MBFI,MC,MDU,MEI,MENT,MGI,MGLN,MHLD,MHO,MLI,MOD,MSA,MTB,MTL,MTRN,MTRX,MYRG,NANO,NBHC,NBTB,NCI,NDSN,NFBK,NMIH,NRE,NSIT,NSL,NSR,NTRS,NVDA,NWBI,OCFC,OGZPY,OKS,ONB,ORBK,ORN,OTTR,PB,PBCT,PEIX,PERY,PES,PFS,PGR,PIP,PIR,PJC,PLXS,PNFP,PPBI,PPR,PRA,PTEN,QUIK,RE,RGA,RMAX,ROLL,ROST,RP,RTEC,SAIA,SAIC,SBSI,SCHL,SFBS,SFNC,SIVB,SJI,SKYW,SLM,SNC,SPR,SPTN,STBA,STBZ,STI,STL,SWM,SXC,TCB,TCBI,TDY,TEX,TLRD,TLYS,TMST,TOWN,TRMK,TRS,TRST,TSC,TTEK,TWI,UAM,UBNK,UBSH,UCBI,UMBF,UMH,UNM,UNVR,USM,UVSP,UVV,VAC,VASC,VECO,VTA,VVI,WABC,WAFD,WCIC,WGO,WRK,WSBC,WTFC,WTI,WWD,XHR,XLNX,XXIA&ta=0&o=-change&r=241

For week of 2016-12-05

http://finviz.com/screener.ashx?v=211&t=ABM,ACTA,ADSK,AEIS,AF,AGCO,AGII,AGO,AGX,AI,AIMC,AIN,AKS,ALIOY,AMBC,AMCC,AMD,APO,ARCB,ATKR,ATW,AXAS,AXE,BAC,BAH,BANR,BFCF,BGFV,BHLB,BIF,BOBE,BRKL,BTO,BWA,BZH,CBF,CBOE,CDEV,CECO,CFFN,CGNX,CHH,CKEC,CLC,CLF,CM,CNOB,COLB,CSFL,CTS,CUBI,CVI,DCI,DCOM,DFRG,DIS,DK,DV,EMKR,ENVA,EOG,ERI,ESSI,EXPD,FAST,FBNC,FBP,FCAU,FCB,FET,FF,FFIN,FIBK,FLO,FMBI,FMCC,FMSA,FNMA,FNSR,FRA,FRAN,FRBK,FRP,GATX,GEF,GFF,GMS,GS,GV,H,HEES,HI,HIIQ,HLT,HMST,HOV,HUBB,HW,HXL,IBKC,IBOC,IBTX,IIVI,IL,INDB,ING,INN,INVN,IOSP,IPI,ISCA,JEC,JFR,JRO,KBAL,KE,KEM,KKR,KLIC,KLXI,KMTUY,LBAI,LRN,LZB,MCFT,MEI,MGI,MGM,MHO,MITT,MOD,MRTN,MSGN,MT,MTSI,NAK,NBHC,NILE,NMIH,NTRS,NVCN,NXST,OCFC,ODP,OFG,ORIG,ORIT,ORN,PBCT,PCAR,PDS,PERY,PES,PFS,PFSI,PIP,PJT,PLAY,PRA,PVTB,PZZA,RHP,RRTS,RVT,S,SAIC,SBCF,SBSI,SCGLY,SCHL,SCMP,SFBS,SFNC,SLM,SMG,SNC,STAR,STAY,STBZ,SWC,TCB,TCS,TER,TICC,TIME,TLRD,TLYS,TRNO,TRST,TSC,TSEM,TTC,UCBI,UMBF,UNVR,UVSP,VASC,VLY,VVR,WAC,WLB,WSBC,XLNX,XXIA,YRCW&ta=0&o=-change

Sunday, December 18, 2016

some learnings from Educsos blogspot

http://educsos.blogspot.com/2015/12/canslim-data.html

SOS called it

Fundamental Based Scans

It is based on CANSLIM methodology for "O'Neil" type stocks.

Some quotes


FOOLISH 8  M
The original Foolish 8 strategy uses eight criteria to look for profitable and rapidly growing small companies with strong price momentum. The methodology is partly built on the premise that the lack of coverage and interest in small-cap companies presents a better opportunity to locate undiscovered, attractive investment candidates.

1. Revenues: $500 million or less
2. Earnings and sales growth: 25% or greater
3. Net profit margin: 7% or greater
4. Daily dollar volume: $1 million-$25 million
5. Insider holdings: 10% or greater
6. Share price: $7 or greater
7. Relative strength: 90 or greater
8. Operating cash flow: a positive number

Here's how I created it in TC2K:


________________________________________________________________________________

SOS also had a blog for his

Slingshot Anticipation Scan


some quotes.

A friend of mine has shown me the value of using Rate of Change to identify compression points in a stock.  We talked about combining a Slingshot in the current bar with a ROC of +/- 2 in the preceding bar.  He personally also conditions a ROC of >15 in the prior 21 bars but since my coding knowledge is more limited, I went after the concept it in a slightly different way by using  a weekly RSI > 51 for now.  I'll likely experiment some more, but I like what I see from this scan so far.

Criteria:


Price = personal preference
Liquidity is true = minv3.1 >=55000   -- Personal preference
Slingshot =  c > xavgh4 and c1 < xavgh4.1 and c2 < xavgh4.2 and c3 < xavgh4.3
ROC (my work around TC2k Limitations) = ((C1/c6)-1) *100
Wilder RSI > 51 weekly -- Self explanatory, but subject to experimentation. 


Mark Minevrini Notes

Mark Minevrini


SEPA

1. Identify Trend template

2. Fundamental Scan-- growth  Sales / margins, relative strength

3.  Leadership

4. Manual Review


Influenced by Weinstein

  1. Every super stock starts big performance in stage 2. 

Avoid buying stage 1 no matter how good the fundamentals may be.


Stage 1 characteristics:

  •  -- price oscillates around 40 week / 200 dma 
  • Can last years

Goal is not to buy cheapest price-- its to buy the right price-- we want stocks that move quickly after you buy them.

Transition from 1 to 2:
Stage 2 will show volume--- should always be a rally of 25-30% before you conclude Stage 2 has begun. 

Transition Criteria 
Series of higher lows,  above 150 and 200 ema
Weekly Charts
Large volume spikes on up weeks
in contrast to low volume pull backs.

Stage 2 Characteristics:
>40Week  and 40 week ema in uptrend
Staircase pattern-- clear uptrend

Stage 2/ 3 transition -- VOLATILITY increases
Major price break on volume
200 DMA flattens


Stage 4: capitulation -- 
price breaks

Conclusion-- Big money is identifying when stage 2 begins

Ride the waves
Within a trend (tide) there will be short term oscillation (waves)
There can be basing 5-25 weeks in a stage 2

Base count-- should stair case up  a stage 2, stock typically has 3 to 5 bases.
You want to get in when institutional money is getting in.

When the leader sneezes the industry catches a cold


Look for contraction areas:


http://educsos.blogspot.com/search?updated-max=2015-09-01T13:43:00-07:00&max-results=7&start=49&by-date=false


Dr. Wish Notes


_________________________________________________________________________________


The Trading Websites I subscribe to and Why


he mentioned the website Stephen Stewart's Picture of Power. I found it very useful and implemented.

The other one is Eric Muathe.  Muathe.com . The method is similar as Stephen's, which looks for weekly momentum in terms of weekly RSI over 68 with volume surge.

Muathe's technique for chasing extended stocks is brilliant and was eye opening for me.

  1. On a daily chart a stock must have 2 days of rest 
  2. On a weekly Breakout 2 weeks of rest
  3. On a monthly 1 week of rest

My process for combining the StockBee Momo Burst With Muathe Ultimate Breakout:
  1. Start with the Scan for 3 year RSI highs (Muathe uses 34 bars as that is the fibonacci number).  I usually get between 150-350 stocks.
  2.  I then sort by highest MDT (on the daily) This tells me which stocks are currently enjoying the highest momentum AND a 3-year RSI high.
  3. Look at charts for weekly breakouts and set alerts.  It's a weekly B/o if has had at least  2 weeks of rest.
  4. Use the StockBee Momo Burst setup for an entry on a daily chart.  I will not take a weekly breakout if the stock is extended on a daily chart.  Although my sample size is still limited, I believe that the best trades result when a tight daily range triggers both a momo burst and a week 1 breakout.
  5. Stock's Risk management works better for me as I feel the %5-8% rule is too nondescript.  On a cheap stock I can have a 20% stop and still only risk .25 of my account depending on position sizing.  That I understand. 

EP and STIB list for week 2016-12-12 to 2016-12-16

EP listing 

http://finviz.com/screener.ashx?v=211&ta=0&o=-change&t=AKAO,GLBS,ATW,PIR,PACD,INVN,MOD,MTL,CONN,VBTX,OKSB,NVDA,BTE,SWC,TEX,NE,FLO,NMIH,AQXP,QHC,NSR,DO,EBS,CETX,IDCC,PAY,PTR,IRET,NDSN,TGH,AOSL,AVGO,GOOG,GOOGL,TSLA,REGN,EGLE,ALXN,AMZN,FNBC,CMG,ULTI,ATHN,SHPG,SMRT,ENT,ILMN,REPH,AKRX,FTK,DYN,MDCA,HTZ,OPHT,DRYS

STIB Listing

http://finviz.com/screener.ashx?v=210&t=AKAO,FRBK,GLBS,SINO,SVNT,ATW,TDW,SDRL,HOS,CRC,MGI,PIR,AVH,TCS,PACD,TWMJF,INVN,PES,NOG,KFY,OAS,RDC,PEIX,MOD,MTL,CDZI,ARRY,ERF,WLL,IONS,CONN,HEOP,VBTX,OKSB,SEAS,FMNB,AMAG,NVDA,SDLP,REN,VECO,BTE,HNI,RDN,SWC,TEX,NE,VCEL,EPM,FLO,NMIH,AMCC,AQXP,SKYW,ALK,QHC,HMST,JBLU,SBRCY,NSR,DO,MNTA,SALT,AEL,NRE,CCRC,RTEC,MOS,USM,SCHL,ANW,RMTI,OGZPY,FBP,RRGB,OPK,UEPS,ZGNX,SBLK,NBL,UAN,THRM,CETX,CRBP,UTHR,DVMT,IDCC,CORT,ORBK,XLNX,STX,GPRE,IRET,NDSN,ALKS,SWM,TGH,CLCD,ARLP&ta=0&o=-change&r=49

Wednesday, December 14, 2016

Resume some level of trading

I resume some level of trading.

1. bought BMY. nice consolidation, look for breakout. BMY has good fundamental. I think their PD1 drug will bring good profit the accelerated profit. I regard it as long term hold. stop around 54.5

2. bought CETX, target 5.5, stop at 4.5.

I did not buy AMGN, the original entry was 146.7, yesterday it went up high as 149.97 due to upgrade. The reason I hesitated to buy it was that it appears a bear flag to me. This is a good fundamental stock. Will keep eye on it.